JUMP-CELL PAINTING CONSORTIUM AND DATASET
The consortium brings together two non-profit organizations, including the Broad Institute of MIT and Harvard, and 10 pharmaceutical partners to generate and share Cell Painting data with the scientific community. Cell Painting is a microscopy assay that can reveal subtle differences in cell images associated with disease or a genetic or drug perturbation. The database, contains data from more than 140,000 samples, including 117 000 compounds, 13,000 overexpressed genes, and 8,000 genes knocked down by CRISPR-Cas9.
Please, check the project landing page for more details.
Chemical perturbation representation
Each point in the applications’ space visualization in the tab Chemical perturbation represents one chemical perturbation (compound). To switch between structural and phenotypic representations, use the toggle button at the top of the page. Each representation was projected onto 2D space using the UMAP algorithm.
Structural representation
Structural representation is given by the Extended-Connectivity Fingerprint (ECFP) representation of each compound. We calculated ECFP using radius = 4 and number of bits = 2048. The UMAP projection was calculated using the Tanimoto coefficient.
Phenotypic representation
Phenotypic representation is given by the CellProfiler features provided by the JUMP-CP consortium. Representations are aggregated over all available biological replicates from different sources, resulting in one representation per compound. To read more about CellProfiler pipelines, go to JUMP-CP consortium pipelines. The UMAP projection was calculated using Euclidean distance.
phenAID: Image-Based Virtual Screening Platform
Extract more from images to drive Drug Discovery with AI:
Ardigen’s phenAID platform enables the identification of small molecule drug candidates through its AI Technology Platform. The Platform integrates the most recent advancements in AI (computer vision and cheminformatics) with molecular biology and medicinal chemistry, bridging the gap between cell imaging and small molecule design. Our unique approach combines molecular structures, high content screening (HCS) images, and omics data to obtain reliable predictions of modes of action and other molecular properties, identify HCS hits, and predict hit candidates. Moreover, its generative component enables fast library design and accelerates the process of lead optimization.
Read more at: Ardigen’s website or contact us using the form
Genetic perturbation representation
In the applications’ space visualization within the Genetic perturbations tab, each point represents a unique genetic perturbation, i.e. a genetic modification of a specific gene. This includes both CRISPR knock-outs and ORF gene overexpression, selectable via with checkboxes at the top of the page. The genetic perturbations are depicted based only on their phenotypic representation, which is projected onto a 2D space using the UMAP algorithm.
The creation of this representation begins with the output from the JUMP-CP CellProfiler pipeline, followed by additional pre-processing steps. These steps include cell count and well position corrections, outlier adjustment, and sphering. Further details on these processes will be provided in an upcoming publication. Additionally, as reported in Lazar et al. study, the chromosome arm effect was estimated and removed from the CRISPRs profiles (but not ORFs).
Compound Properties and Modes of Action
For each compound, the application displays the name, SMILES, structure visualization, and the information about known properties and known modes of action. For some compounds, the information is missing since the biological activity data is not available in the public domain. The information about known modes of action and properties of compounds are sourced from CHEMBL database.
Experimental Property Prediction
We trained Machine Learning models to predict the missing modes of action and properties of JUMP-CP compounds. Our models are based on human-defined representations, ECFP and CellProfiler features, and trained using the compound set from Bray et al. dataset. The models are trained on a very limited number of publicly available labels, so their predictive power is suboptimal. However, our research suggests that the predictive power improves significantly with the amount of labels used in training. If you want to contribute to the expansion of publicly available data and share your results, please contact the JUMP-CP Consortium.
Find Closest Compounds or Closest Genetic Perturbations
Using this option, you can find the nearest neighbors in both structural and phenotypic representation spaces. To find the closest compounds, select the number of phenotypic or structural neighbors to display (it is possible to select both or just one of the options) , and press ‘Find’. Neighbors will be marked and remain marked until you choose to go back to the main compound. Notice that you can display both types of neighbors in phenotypic and structural spaces, therefore it is possible that structural neighbors are not close to the main compound in phenotypic space and vice versa.
Structural representation (chemical perturbations only)
Set of the closest compound in structural representation space is calculated using the k-nearest neighbors algorithm on 2-dimensional space obtained using the UMAP algorithm from the ECFP representation.
Phenotypic Representation
Set of the closest compounds in phenotypic representation space is calculated using the k-nearest neighbors algorithm on 4-dimensional space obtained using the UMAP algorithm from the original CellProfiler features space.
Mark Clusters
Mark clusters option presents clusters of compounds pre-calculated using the Birch clustering algorithm. Clusters in the phenotypic representation space were calculated using a 4-dimensional projection while clusters in the structural representation space were calculated using a 2-dimensional projection.
Image Display
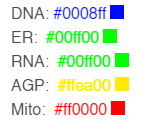
Images displayed in the application were preprocessed to create RGB images from the 5-channel fluorescent CellPaint images. To read more about experimental protocol, go to Cell Painting wiki.
To improve the display, we remove outliers (clip 0.05th percentile of values and 99.95th percentile of pixel values from each channel separately) and normalize images to use the full range of values. This process is performed independently for each field of view. Channels are presented using the following colors:

